Get Powerful Insights,
Visualize Your Work

Get Powerful Insights,
Visualize Your Work

Overview your team and work performance with rich data charts and
support your decisions with your past behaviour

M

UI UX Design

Completed

20/20

10 Jun

Design

Your effort matters,
when it's measured and analyzed

Measure your team and project efforts and turn them into actionable insights with detailed dashboards

0

100

200

300

400

500

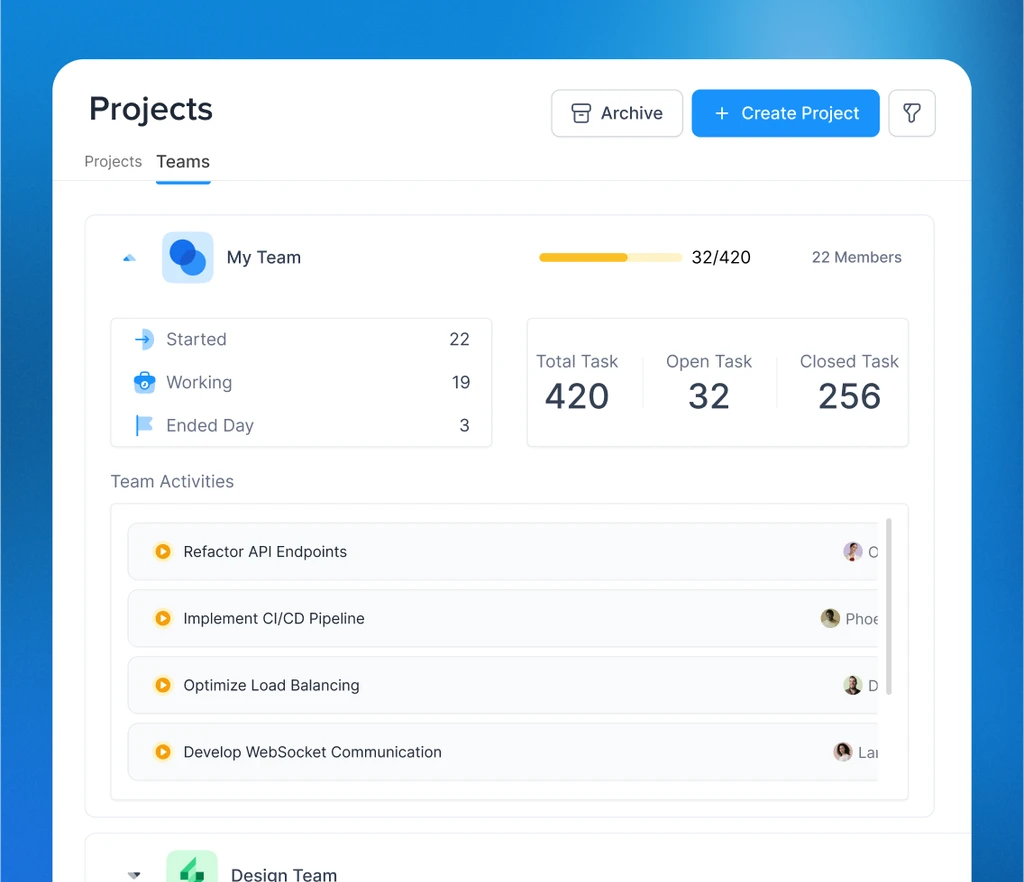
See who worked on what

Visualise the people effort in seperated projects & issues

0

100

200

300

400

500

See who worked on what

Visualise the people effort in seperated projects & issues

0

100

200

300

400

500

See who worked on what

Visualise the people effort in seperated projects & issues

0

100

200

300

400

500

Measure Productivity

Follow up your productivity performance with smart charts

0

100

200

300

400

500

Measure Productivity

Follow up your productivity performance with smart charts

0

100

200

300

400

500

Measure Productivity

Follow up your productivity performance with smart charts

0

100

200

300

400

500

8 task

16h spent

340 point

Track & log your time

Answer the question of each tasks effort & hours spent with ease

0

100

200

300

400

500

8 task

16h spent

340 point

Track & log your time

Answer the question of each tasks effort & hours spent with ease

0

100

200

300

400

500

8 task

16h spent

340 point

Track & log your time

Answer the question of each tasks effort & hours spent with ease

Increase your productivity by Peerbie Insights

Log Times
Log Times
Log Times

Log Times in tasks & projects

Log time spent on tasks and projects effortlessly, ensuring accurate tracking and reporting.
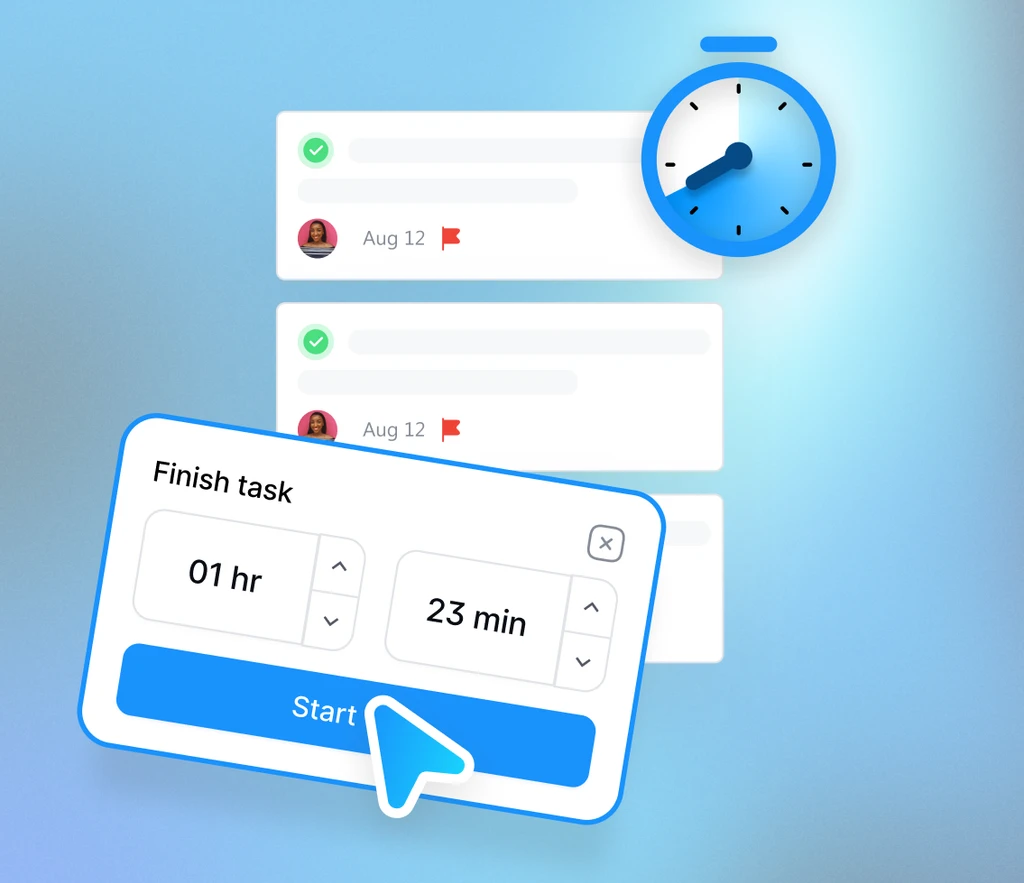
Predict & Calculate your effort

Utilize Peerbie to predict and calculate the effort required for tasks, ensuring efficient resource allocation.

An illustration from Carlos Gomes Cabral

3.

Peerbie user 3

🥉Jumo Omondi

240

2.

peerbie user 2

🥈Emma Wright

234

1.

peerbie user

🥇Wei Chan

350

Checkbox

3 Task Complated

Timer

5.6 Hours Working

An illustration from Carlos Gomes Cabral

3.

Peerbie user 3

🥉Jumo Omondi

240

2.

peerbie user 2

🥈Emma Wright

234

1.

peerbie user

🥇Wei Chan

350

Checkbox

3 Task Complated

Timer

5.6 Hours Working

An illustration from Carlos Gomes Cabral

3.

Peerbie user 3

🥉Jumo Omondi

240

2.

peerbie user 2

🥈Emma Wright

234

1.

peerbie user

🥇Wei Chan

350

Checkbox

3 Task Complated

Timer

5.6 Hours Working

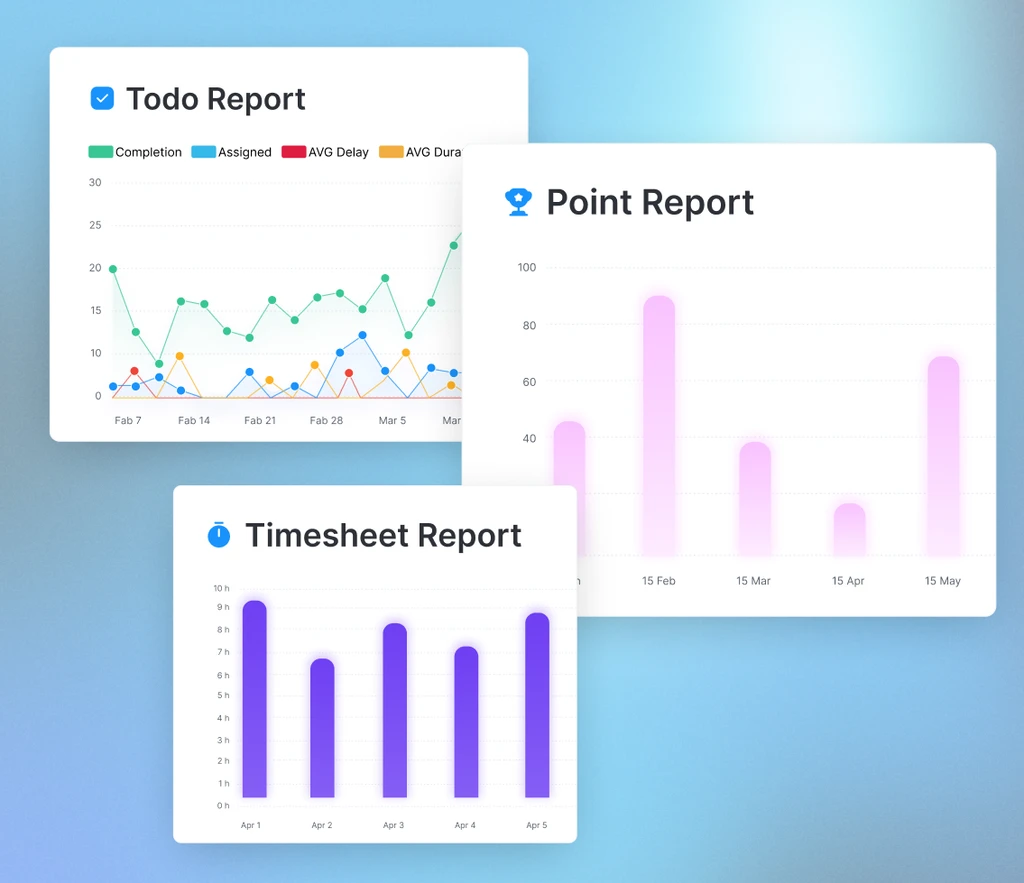
Visualise with dashboards

Visualise with dashboards

Measure team and project efforts with our detailed dashboards, turning data into actionable insights.

Get valuable insights

Gain a comprehensive view of your team’s performance with rich data charts. Support your decisions with insights derived from historical data.

An illustration from Carlos Gomes Cabral

Ready to enhance your team's productivity?Join now

Todo Report

Completion

Assigned

AVG Delay

AVG Duration

30

25

20

15

10

0

Fab 7

Fab 14

Fab 21

Fab 28

Mar 5

Mar 12

Point Report

100

80

60

40

20

0

15 Jan

15 Feb

15 Mar

15 Apr

15 May

15 Jun

Timesheet Report

10 h

8 h

6 h

4 h

2 h

0 h

9 h

7 h

5 h

3 h

1 h

Apr 1

Apr 2

Apr 3

Apr 4

Apr 5

15 Jun

Frequently asked questions.

What is the main purpose of this Peerbie Insights?
Can I try the tool for free?
How can I see who worked on what?
Can I track and log time spent on tasks?
How does the tool help in predicting and calculating effort?
What are the benefits of using detailed dashboards?
How can I gain valuable insights from the tool?