Peerbie Insights
Peerbie Insights User Guides - Peerbie
What is Insights on PeerBie? How Does It Work?
PeerBie Insights help tracking organizational performance. It facilitates performance measurement by providing multiple types of reports and filtering systems.
How to Use Insights?
Select “Insights” on the left side of the homepage
Each report table/graphic can be filtered by month/week/day or intervals of time and department/team/individual
Reports can be downloaded in SVG, PNG, CSV formats
There are 4 types of reports:
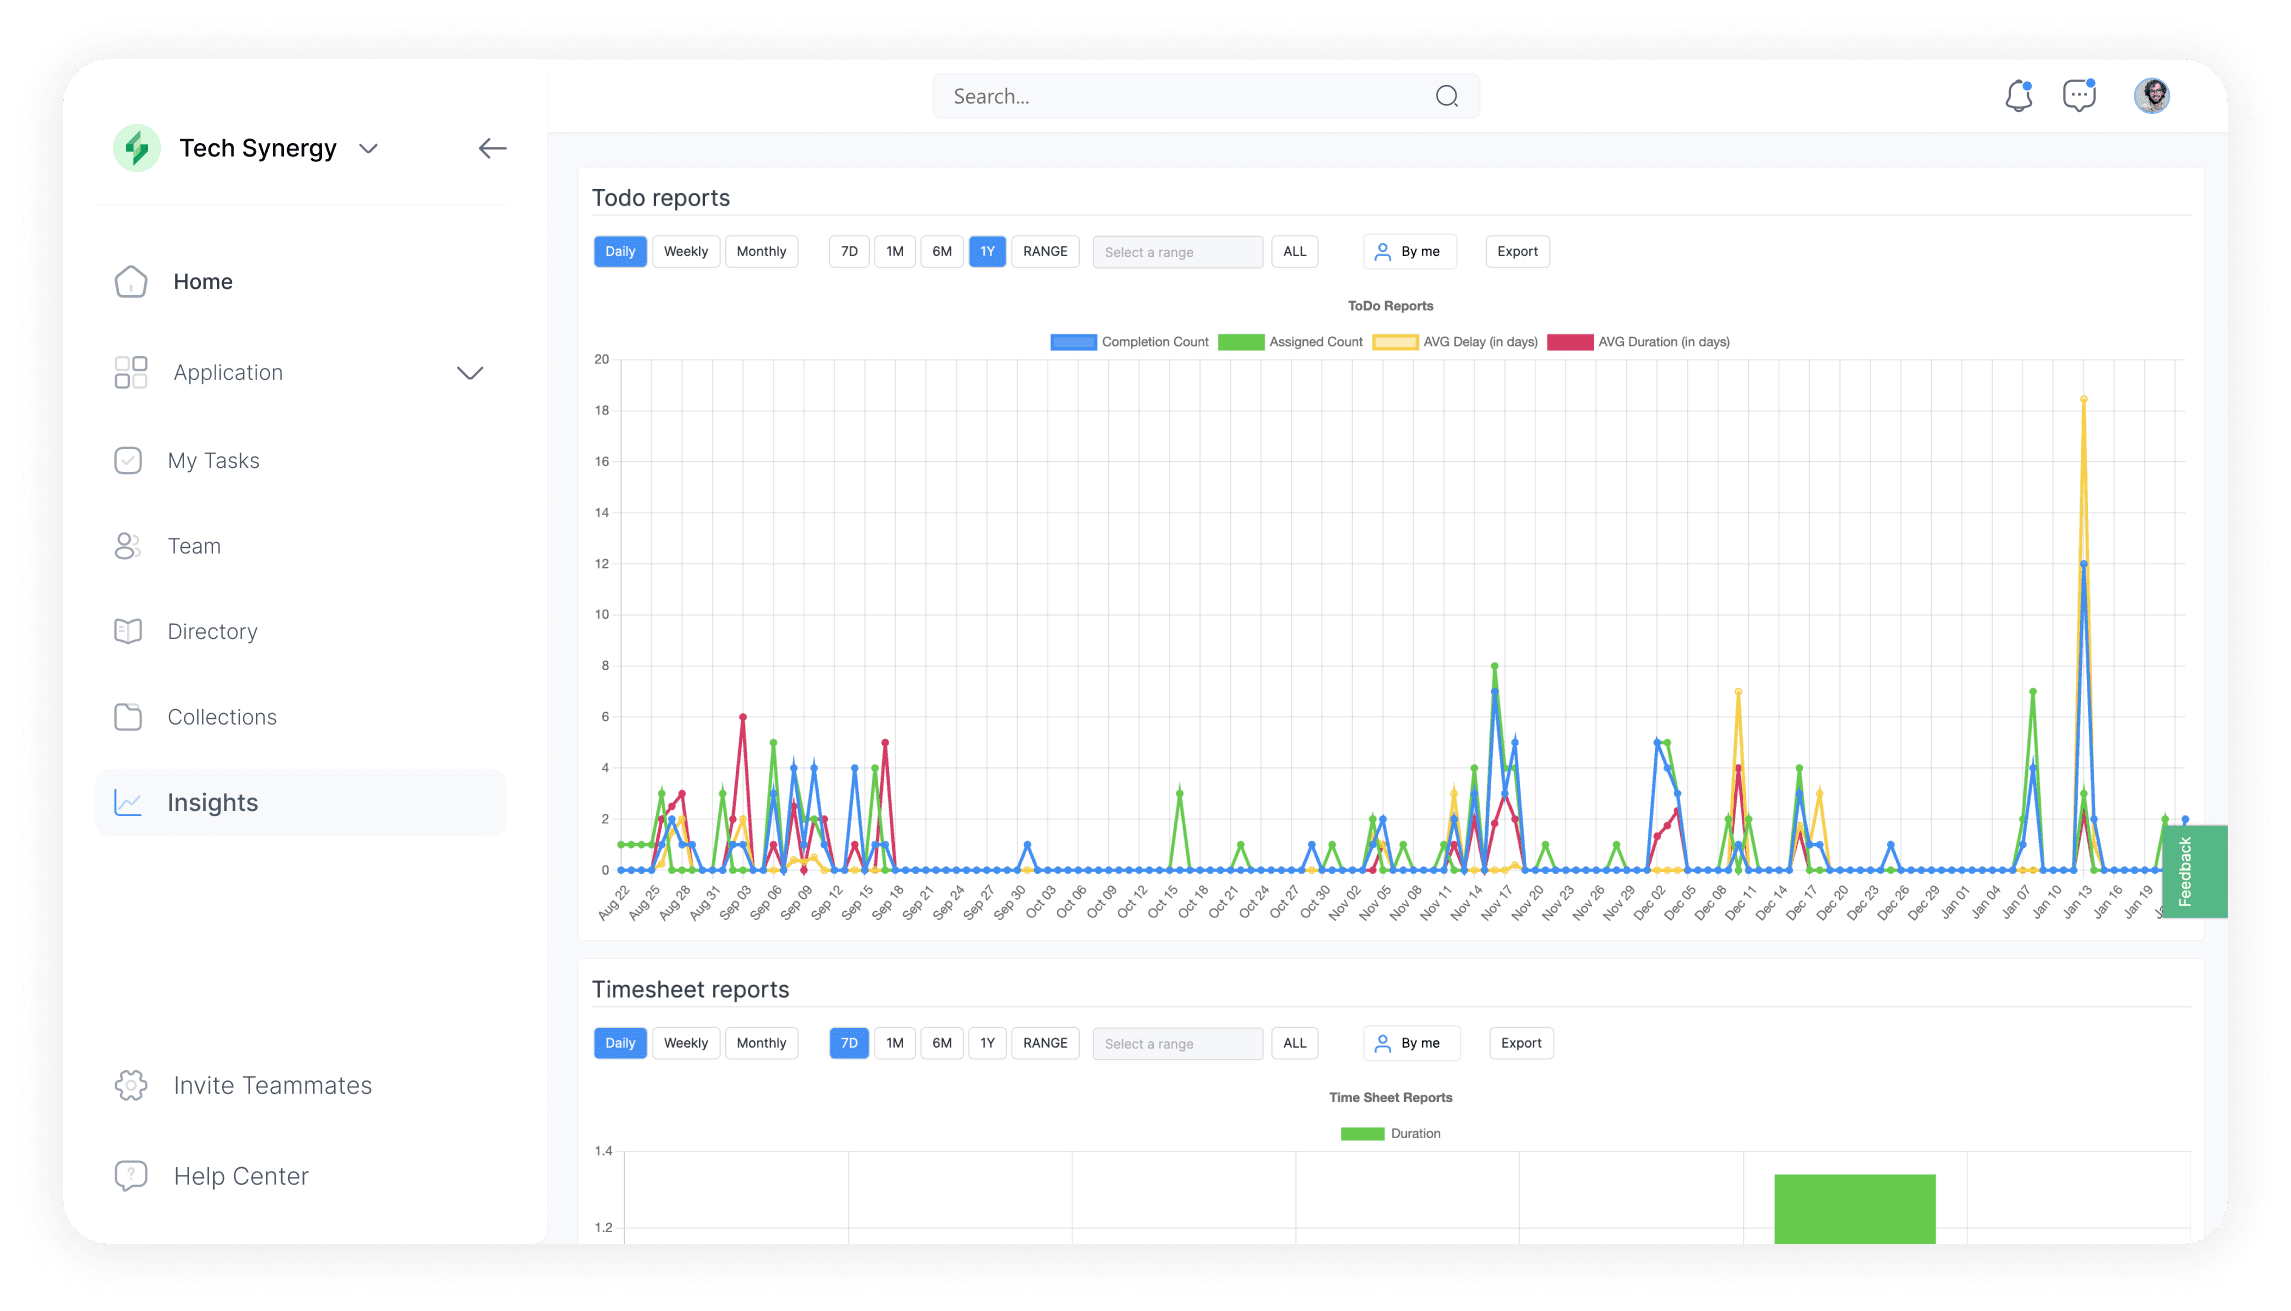
A) To-Do Reports: You can select individuals or teams here. Shows 4 parameters
Blue Line: Shows completed tasks
Green Line: Shows assigned tasks
Yellow Line: Shows the average delay (in days)
Red Line: Shows the average duration (in days)
B) Timesheet Reports: Shows total work time. Again you can choose individuals or teams to display here. This report displays time between “Start day” and “End day”.
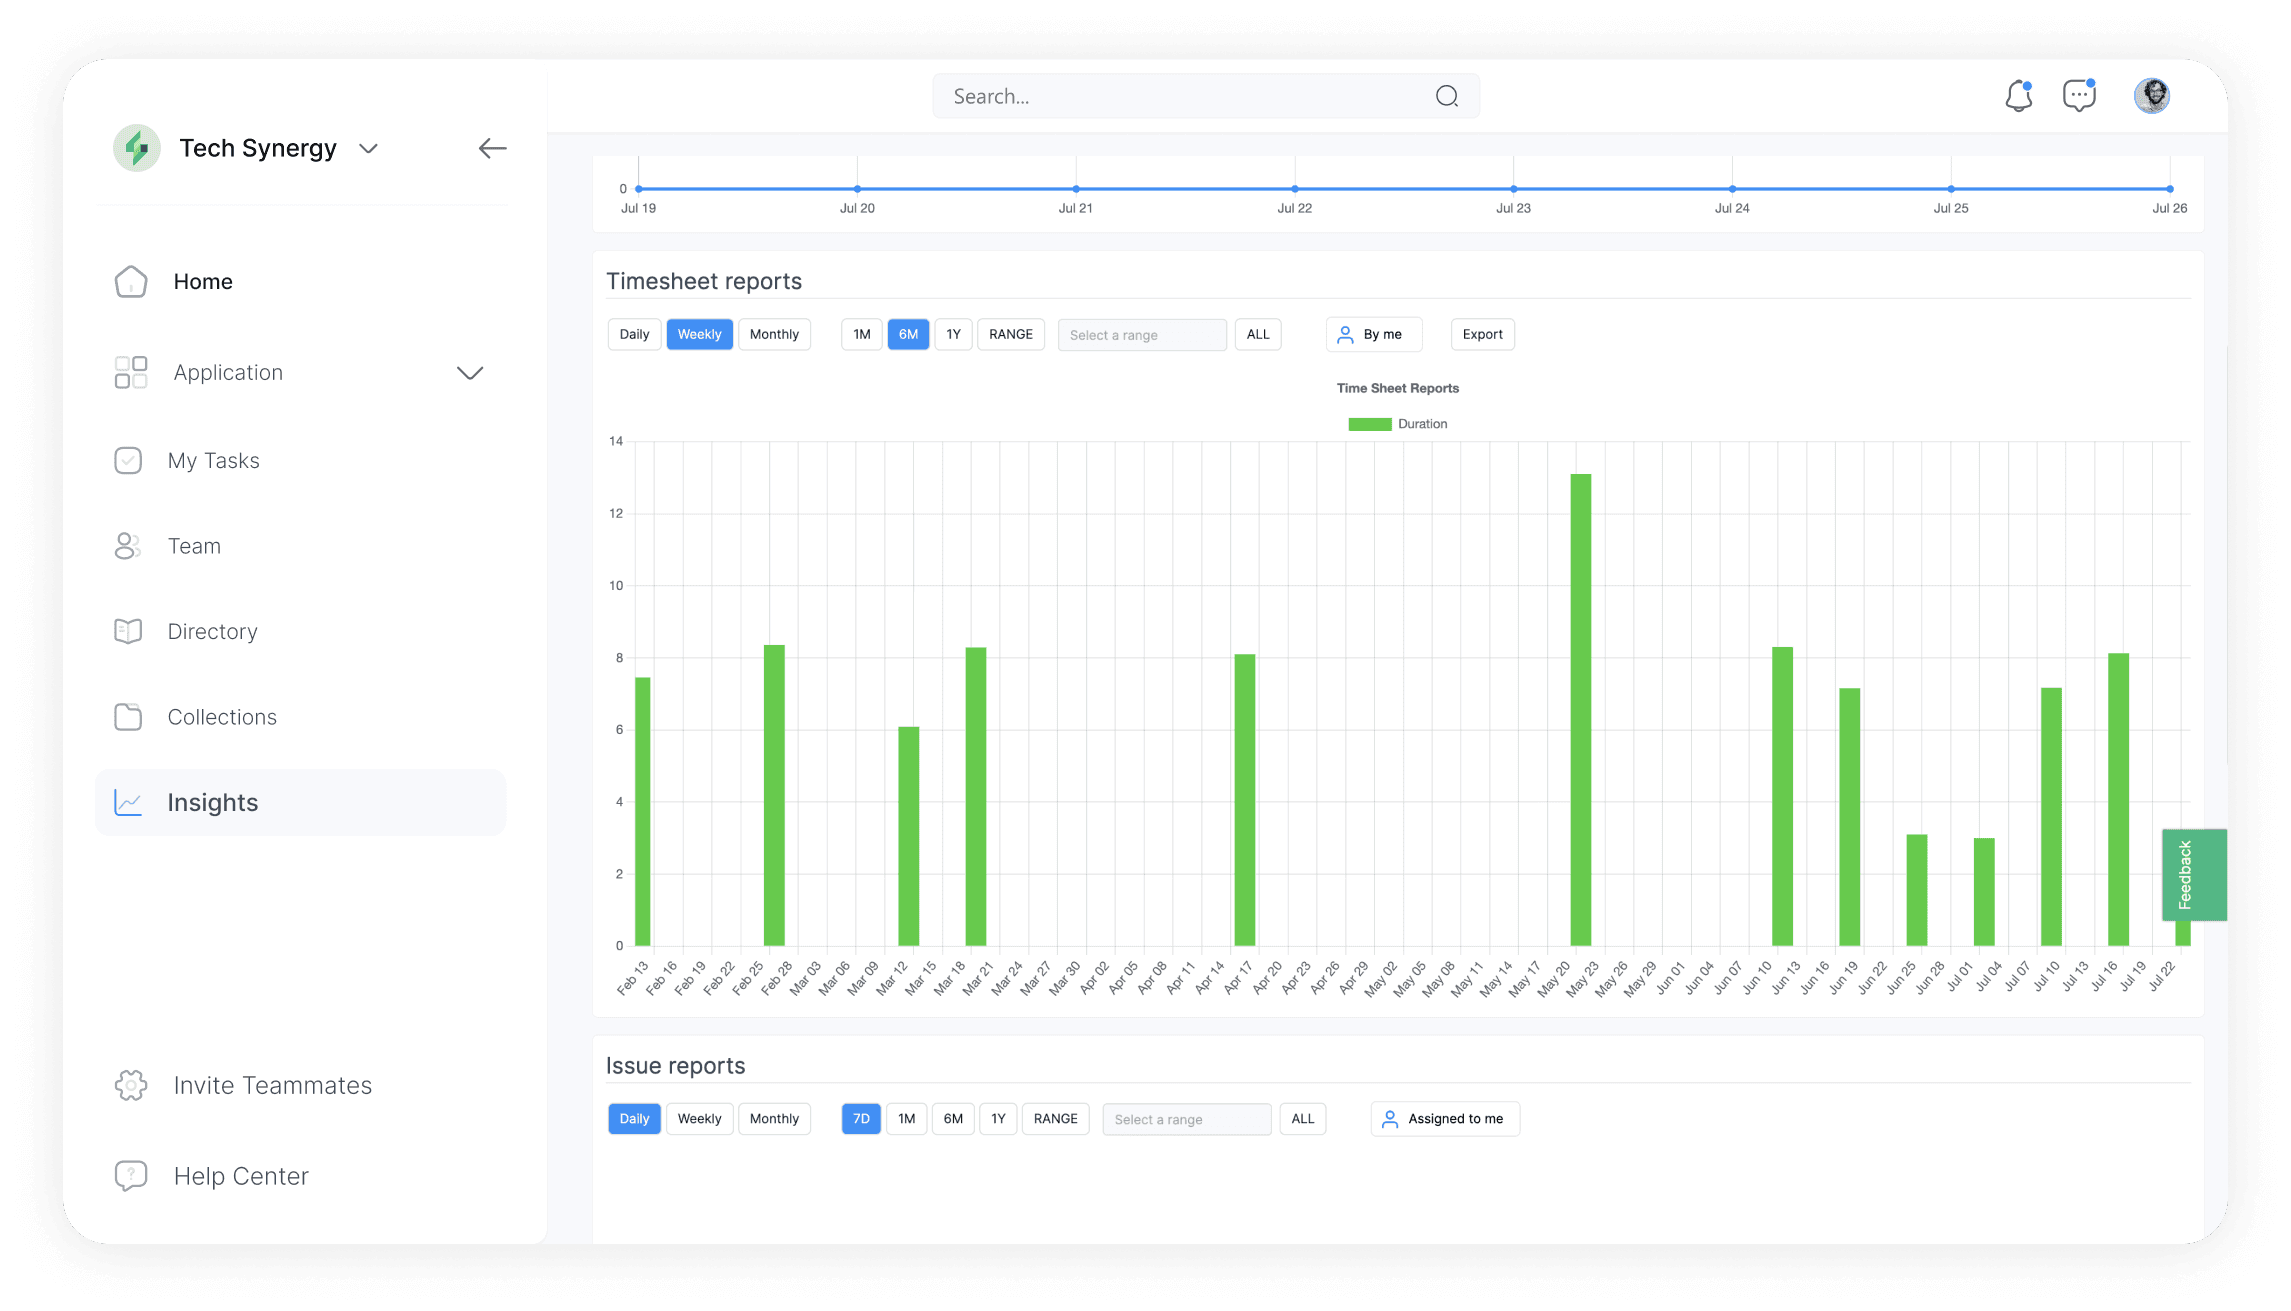
C)Issue Reports: Provides issue, enhancement trends on services and products. This will be obsoleted soon with new applications.
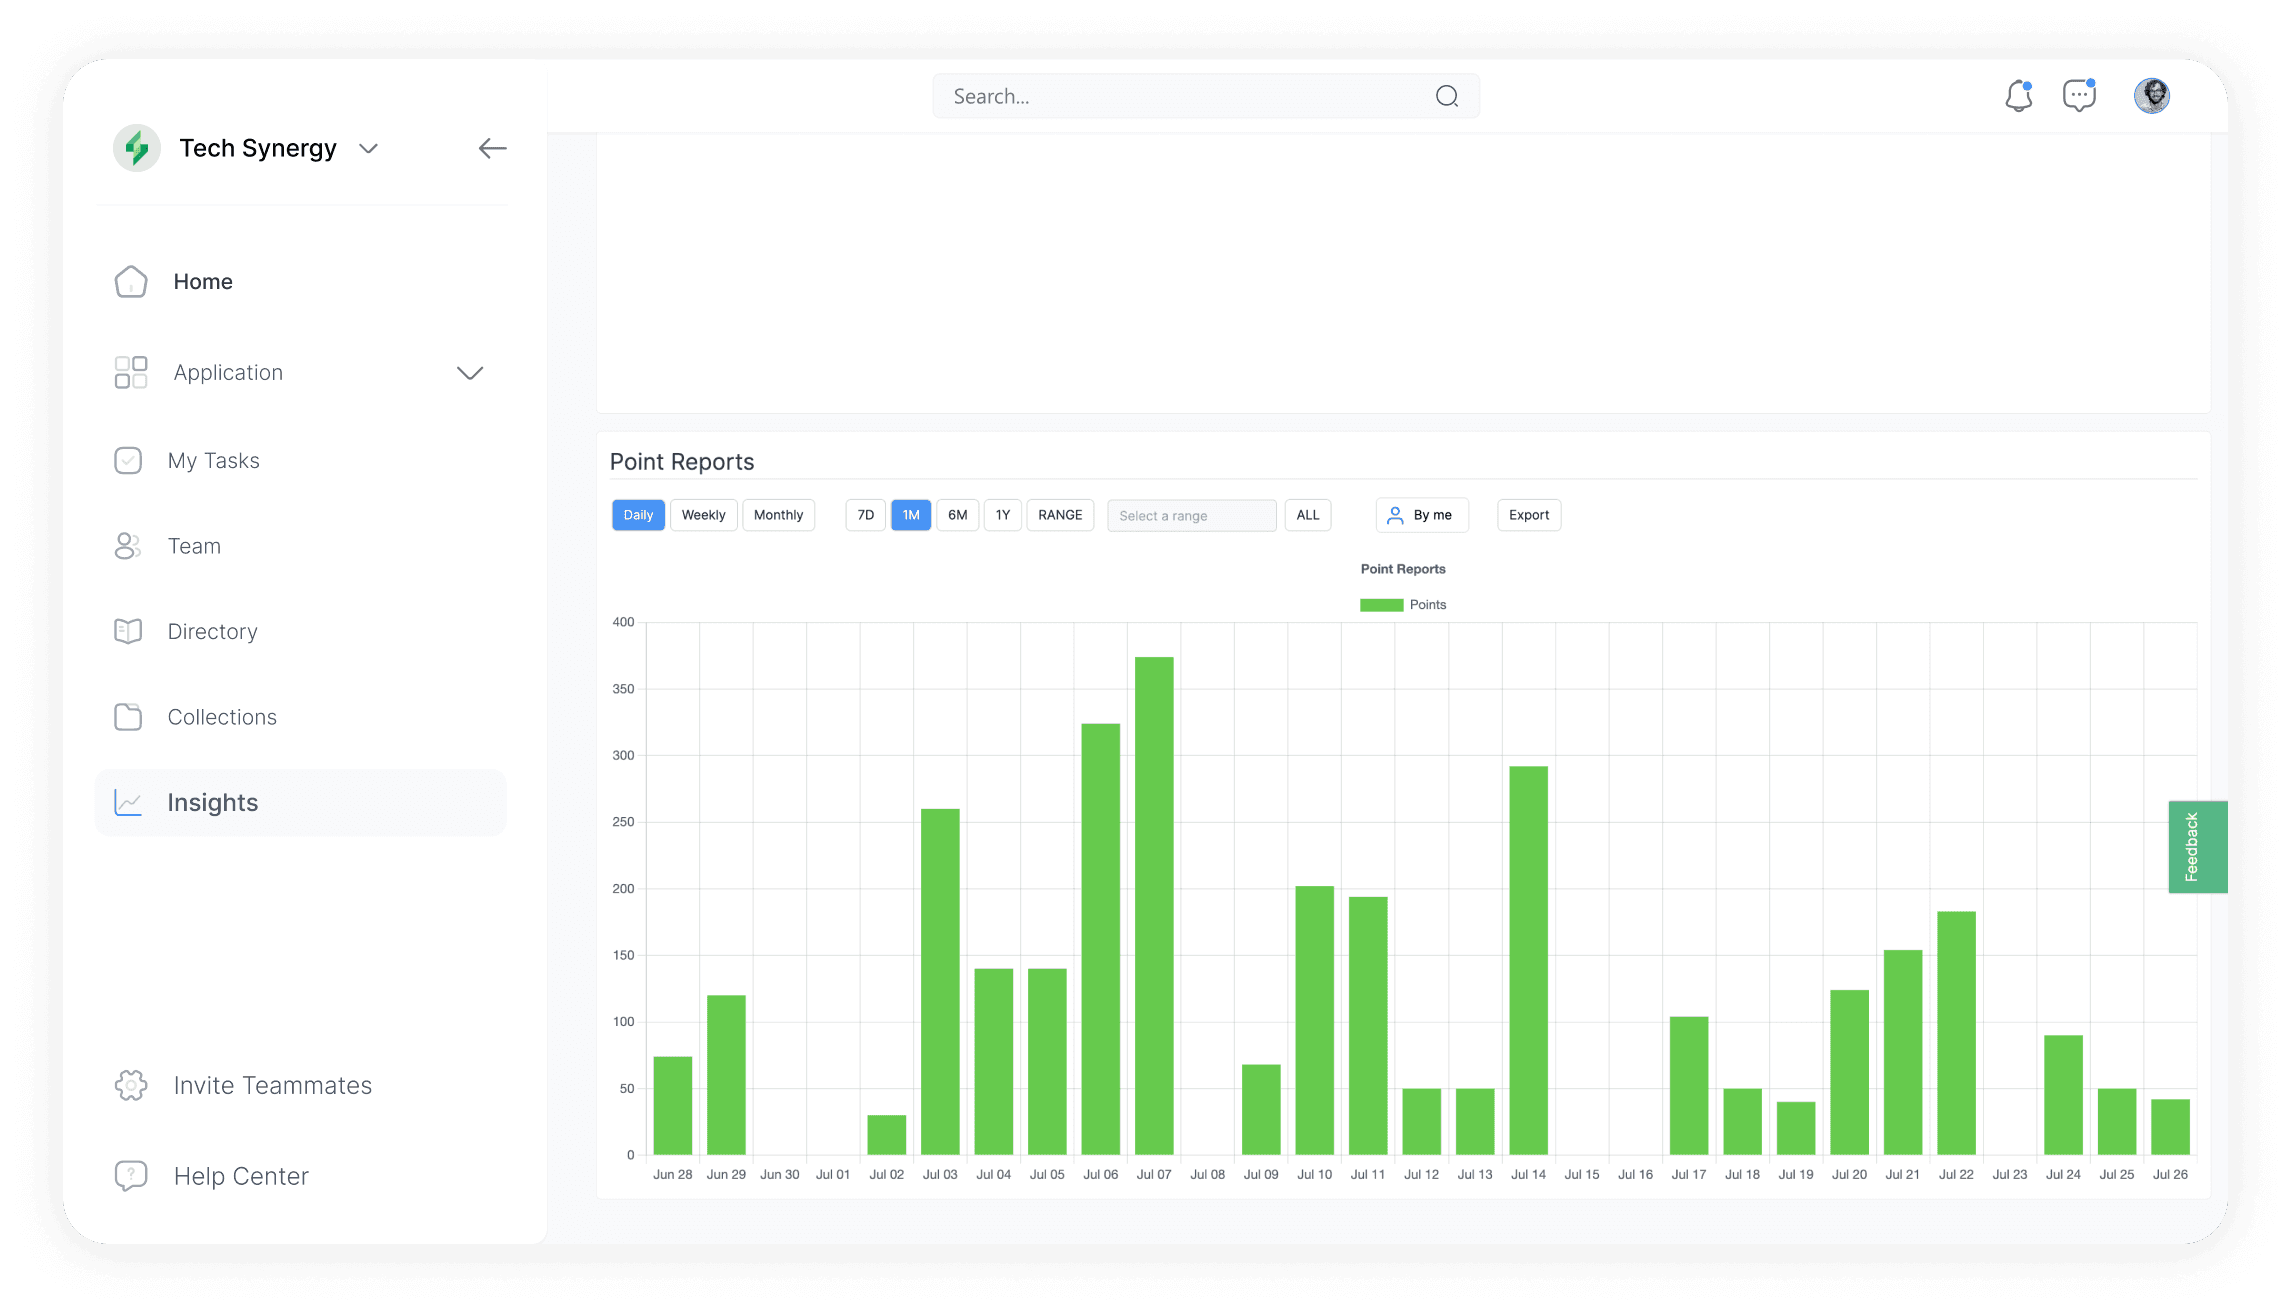
Performance Reports: Shows performance points based on work completed, survey participation etc.. Points are calculated on a daily basis in real-time and aggregated per employee and employee teams. Multiple variables impact point calculation:
Number of tasks closed
Task being closed on time
Task estimate and actual time
Task priority
Communication amongst team members
Participation in meetings, video conferences, polls